WALMART INTERNAL FINANCECollaborating on data in one shared workspace
Designing alerts and collaboration tools for Walmart's IBG platform, cutting anomaly-alert time by 27% and moving 68% of task completion fully in-product.
ROLEProduct Designer
DURATION8 months
TEAMProduct Manager, 5 Product Designers
TOOLSFigma, Jira, Google Suite
IMPACT68%
task completion fully in-product vs other tools
27%
faster to alert team members of potential data anomalies
Walmart employees work from mismatched numbers, forcing them to manually reconcile data across teams instead of seeing what their peers and finance partners see. As a result, problems and opportunities surface only after the fact, not in real time.
CHALLENGEGive accountants a shared workspace with real-time anomaly alerts and inline comments, so questions get resolved next to the numbers instead of in email. AI continuously scans in the background to surface opportunities they'd otherwise have to dig for manually.
SOLUTION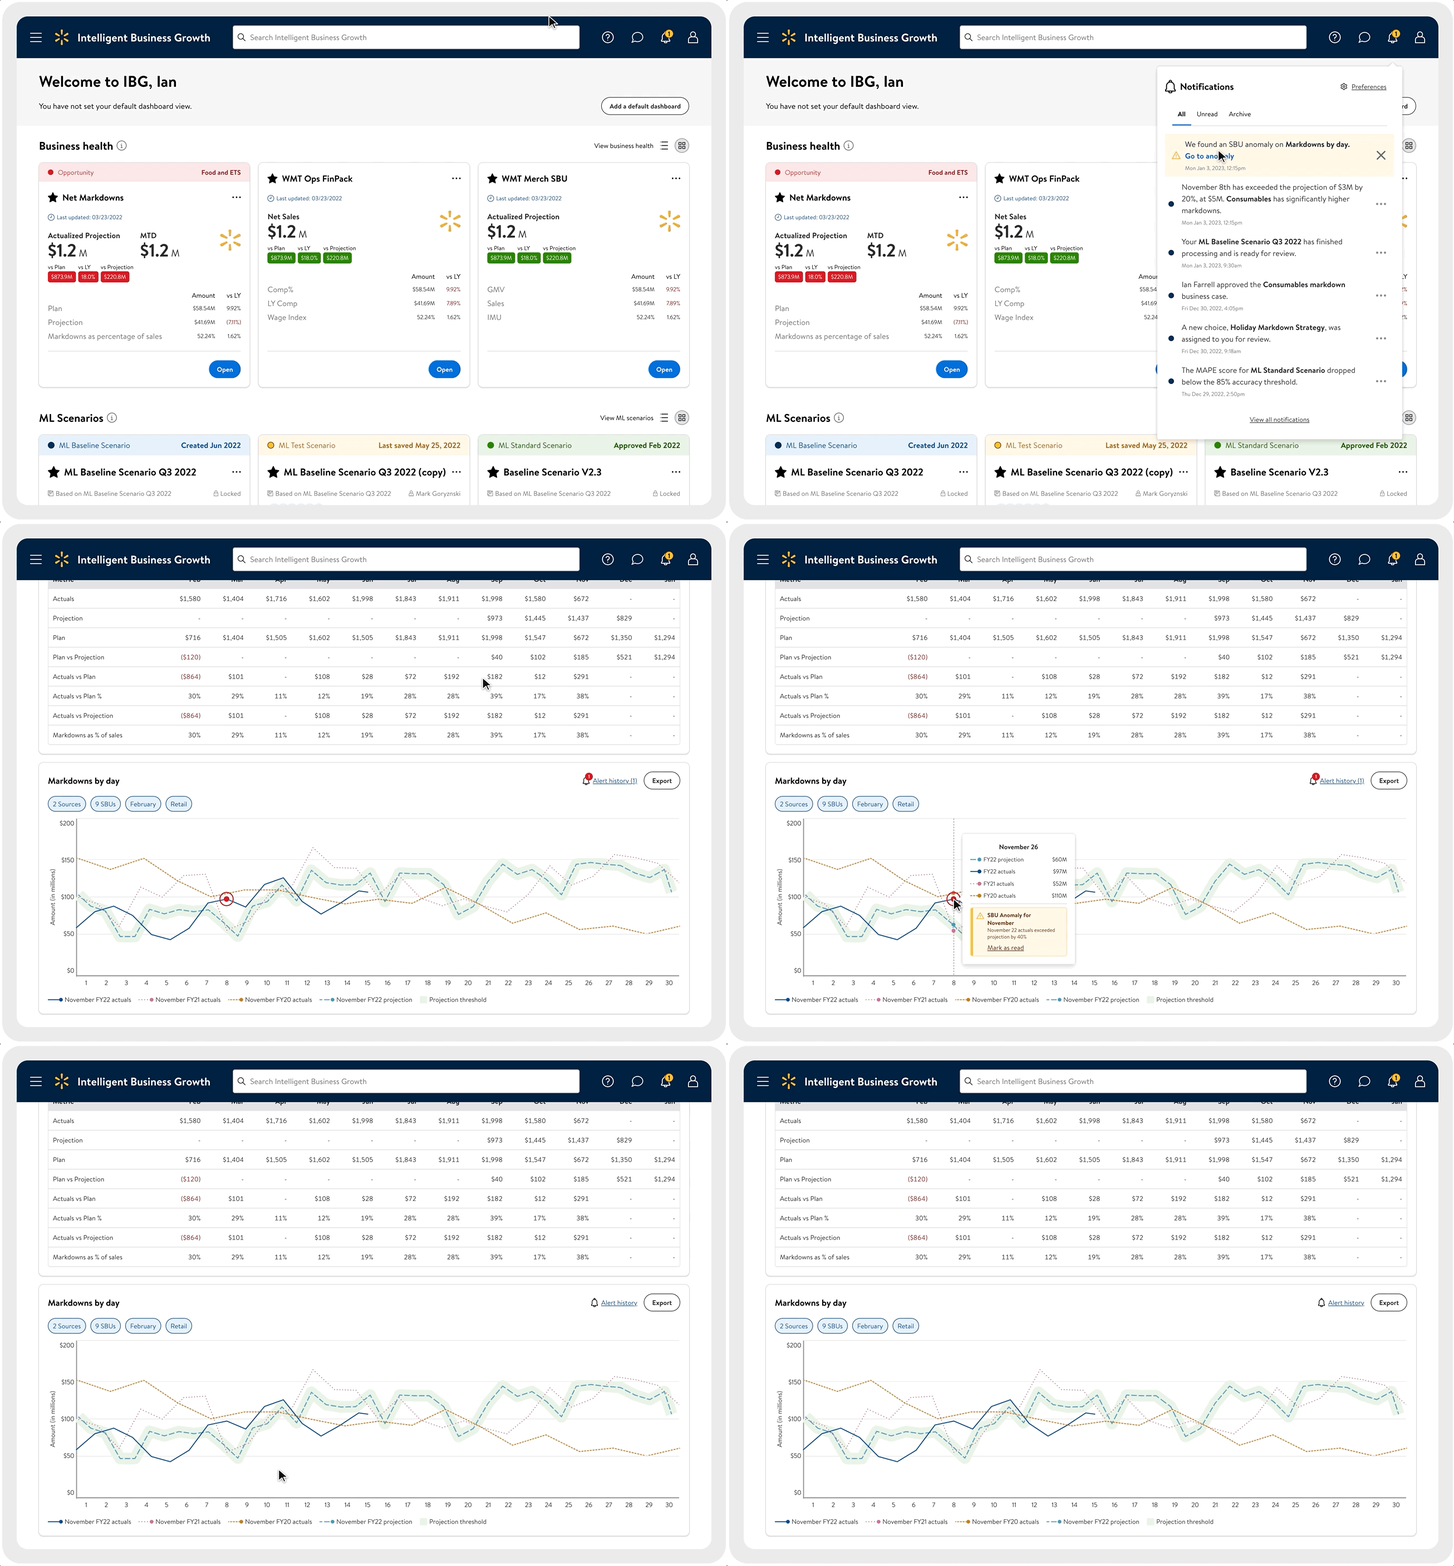
An example flow of finding and resolving an alert.
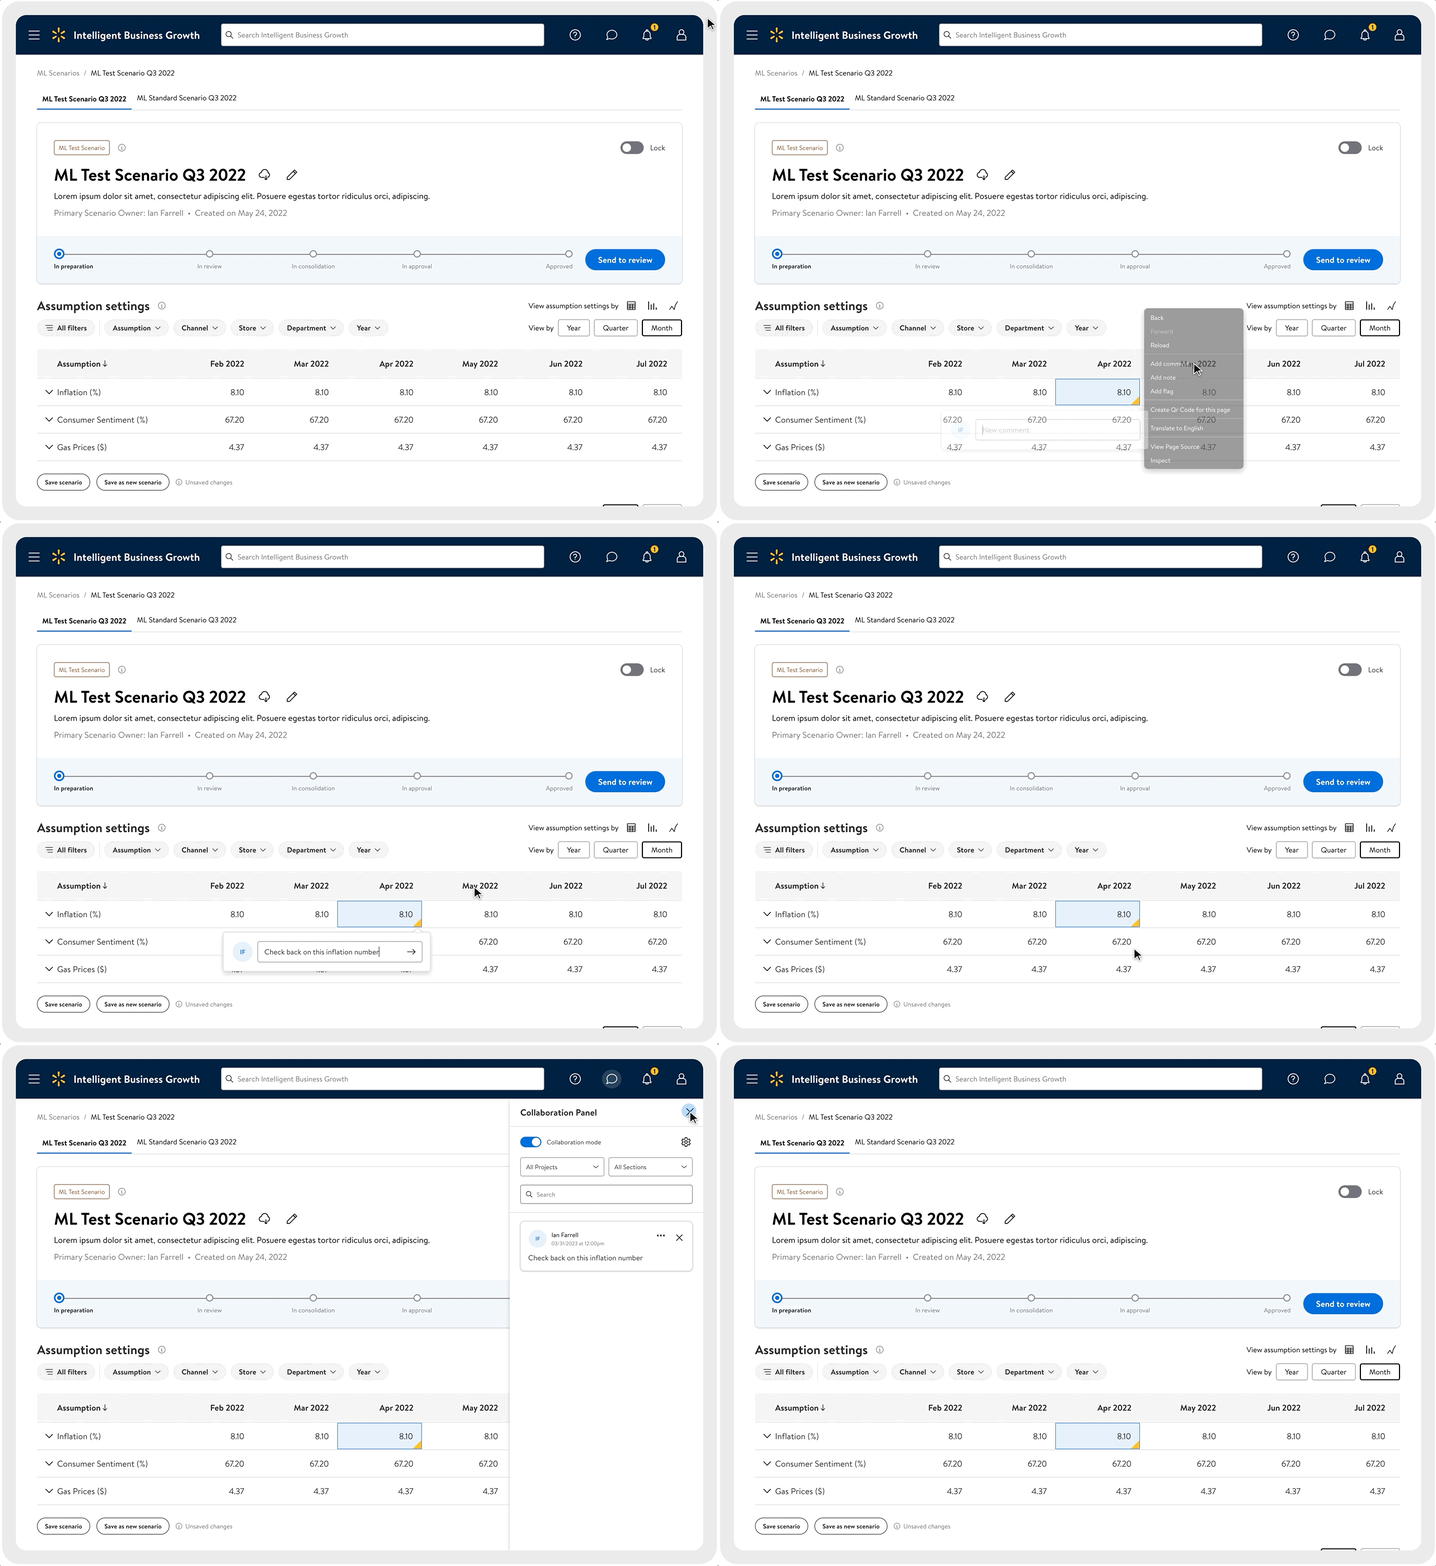
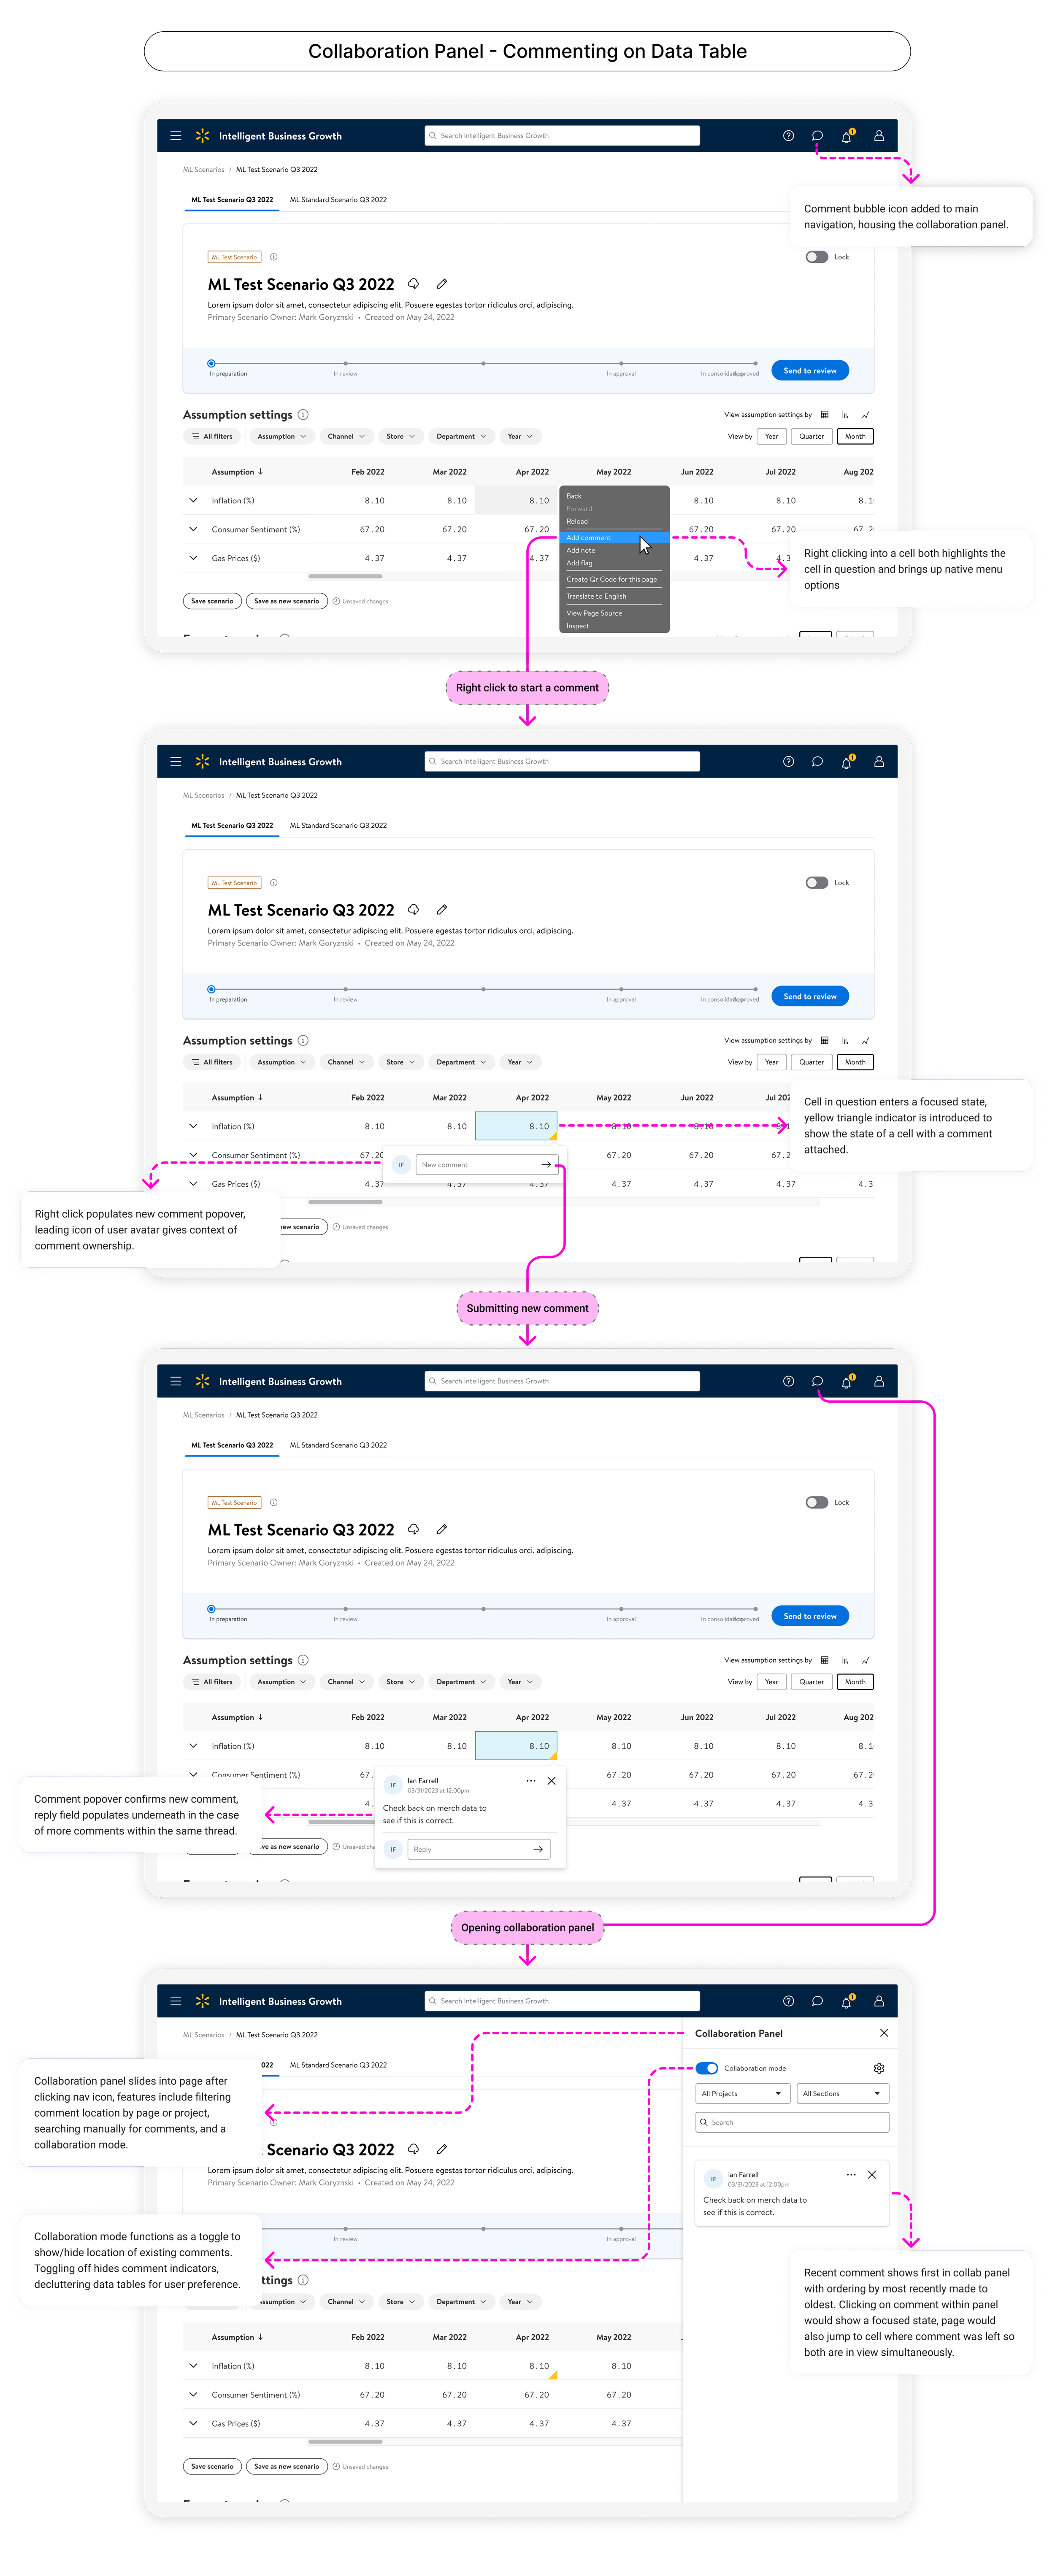
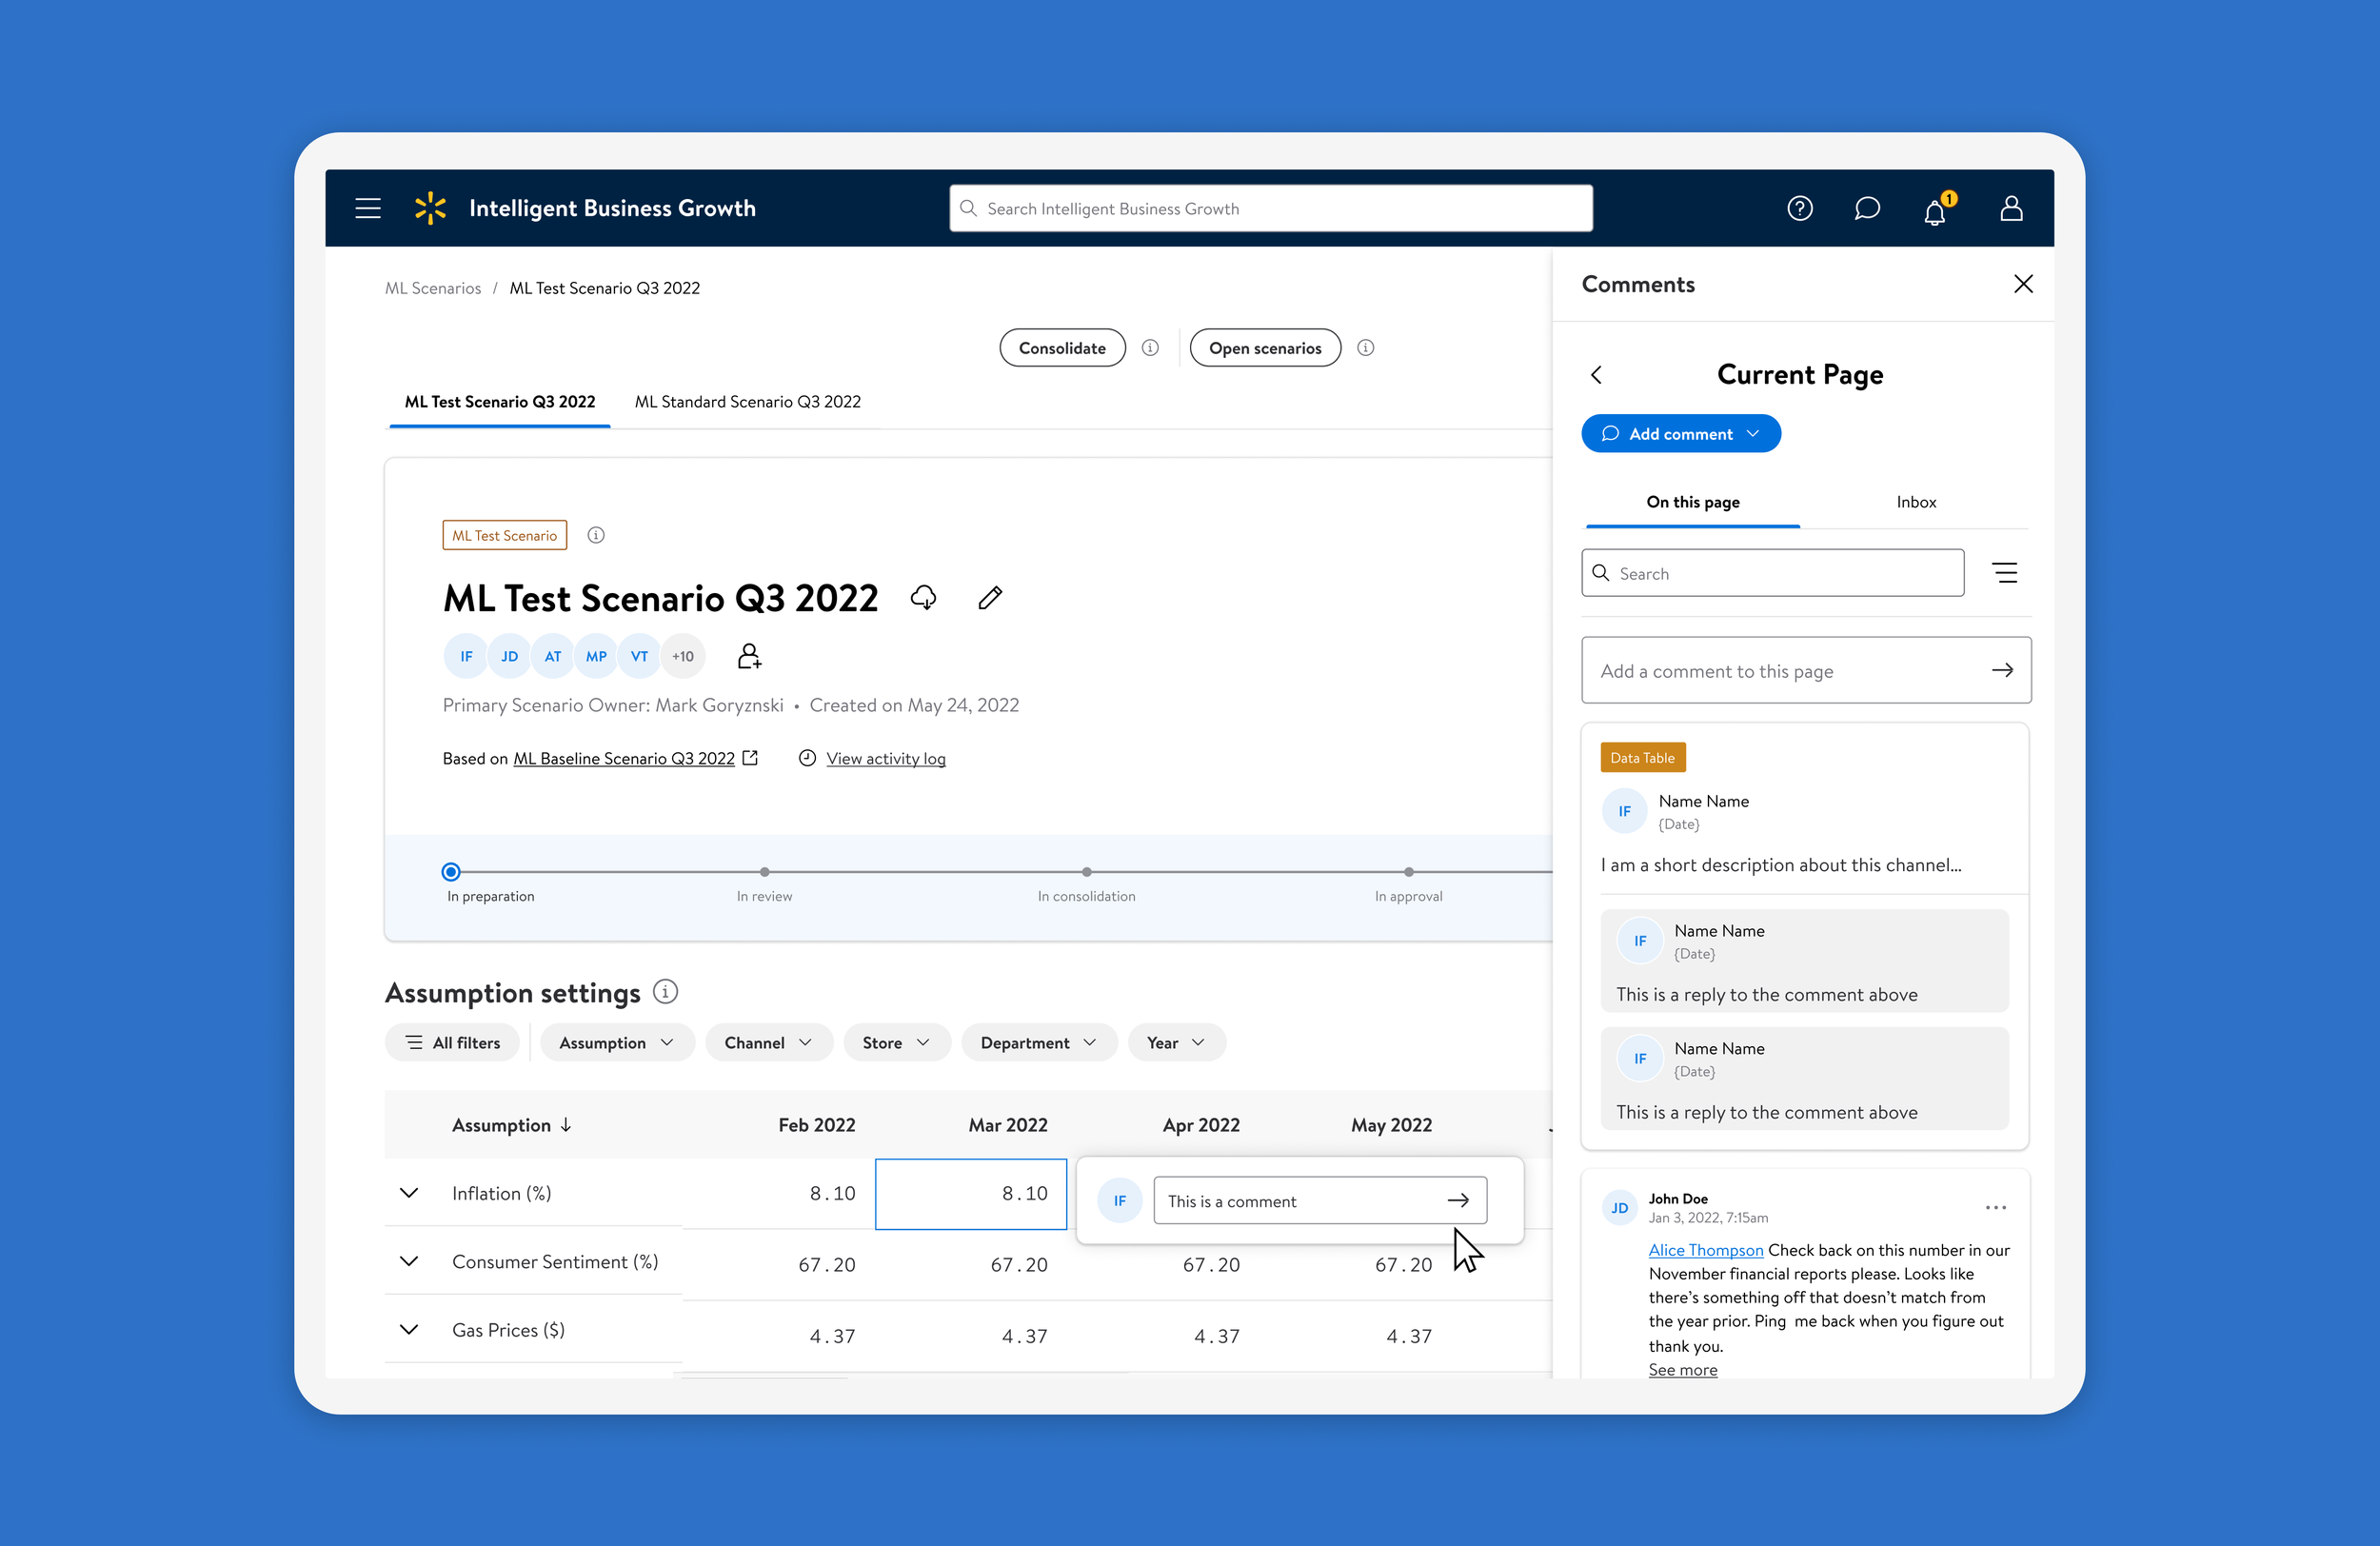
An example flow of commenting on a data cell.
KEYS TO SUCCESSI built comments as context-dependent, not one-size-fits-all.
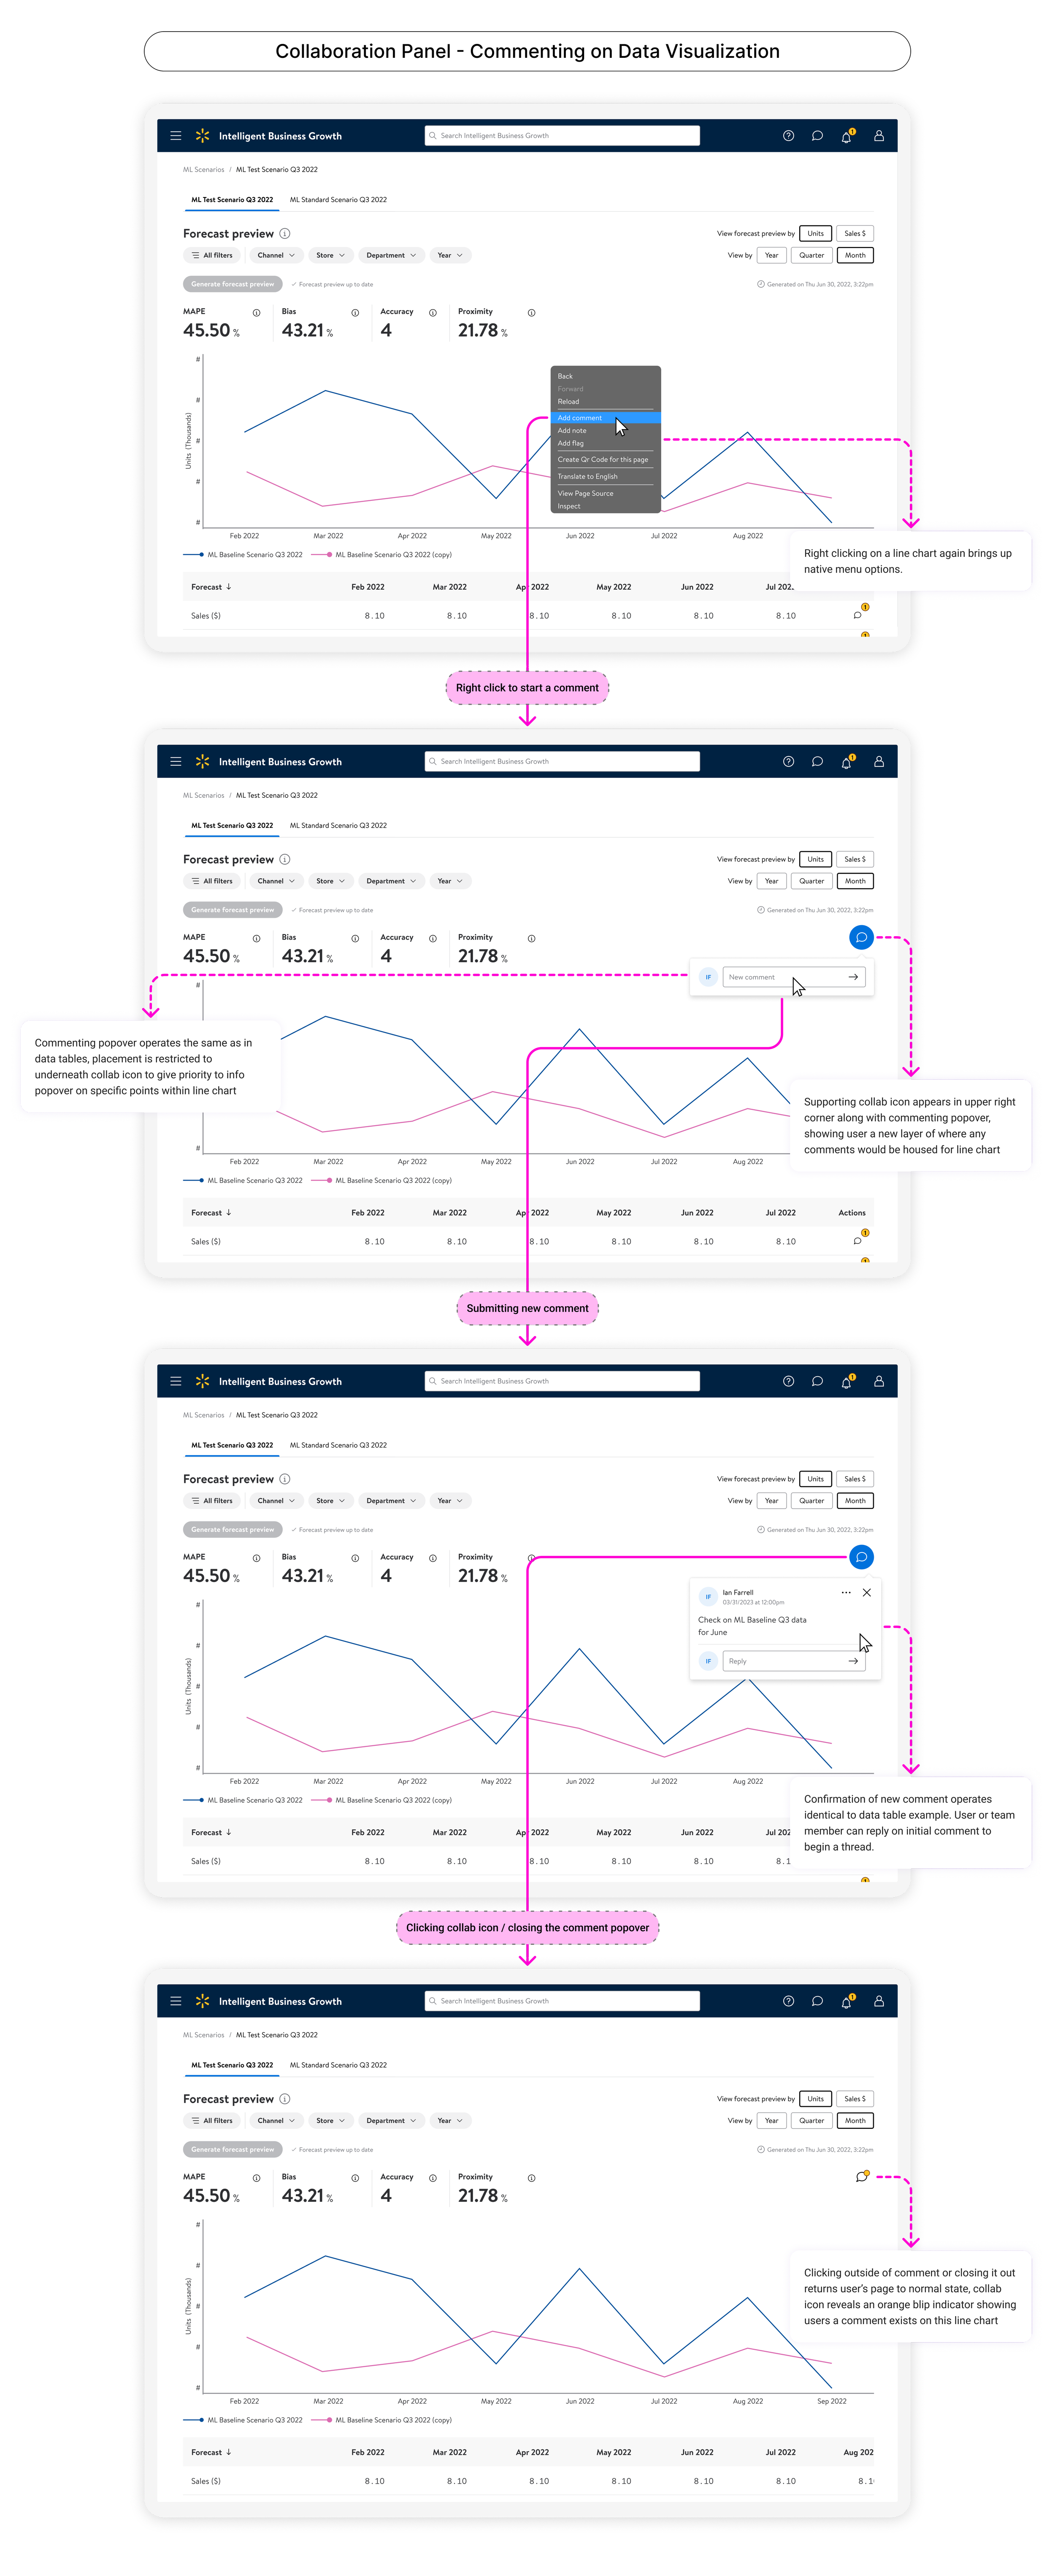
Comments look and behave differently depending on whether they’re left on a data table. That's because leaving a comment “here" means something different depending on what "here" actually is.
I designed components to flex to a system, not just one screen.
Since the project spanned all four IBG workstreams, not just one, components had to be flexible rather than fixed. Each workstream's designer set their own severity levels, since "urgent" means something different in each context.
I defined a shared vocabulary before building UI.
Defining "alerts" (visual cues tied to specific data conditions) and "notifications" (general informational messages) as distinct from the start gave all four workstreams a shared vocabulary, instead of each team inventing its own way to "flag" something.
LEARNINGSAgree on words before you design.
When several teams are building on the same system, deciding what terms mean (like "alert" vs. "notification") up front stops the four versions from slowly turning into four different things over time.
Let the people closest to the data decide what counts as urgent.
Urgency usually depends on the specific context, so a single central rule often works worse than trusting the people who actually understand that data.
THE LARGER STORYIBG (Intelligent Business Growth) designs AI-powered financial planning tools within Walmart's ecosystem, spanning four interconnected workstreams (A–D). Though primarily embedded in Workstream B (business monitoring), my project was workstream-agnostic, exploring how visual alerts and in-product collaboration could apply across the full platform.
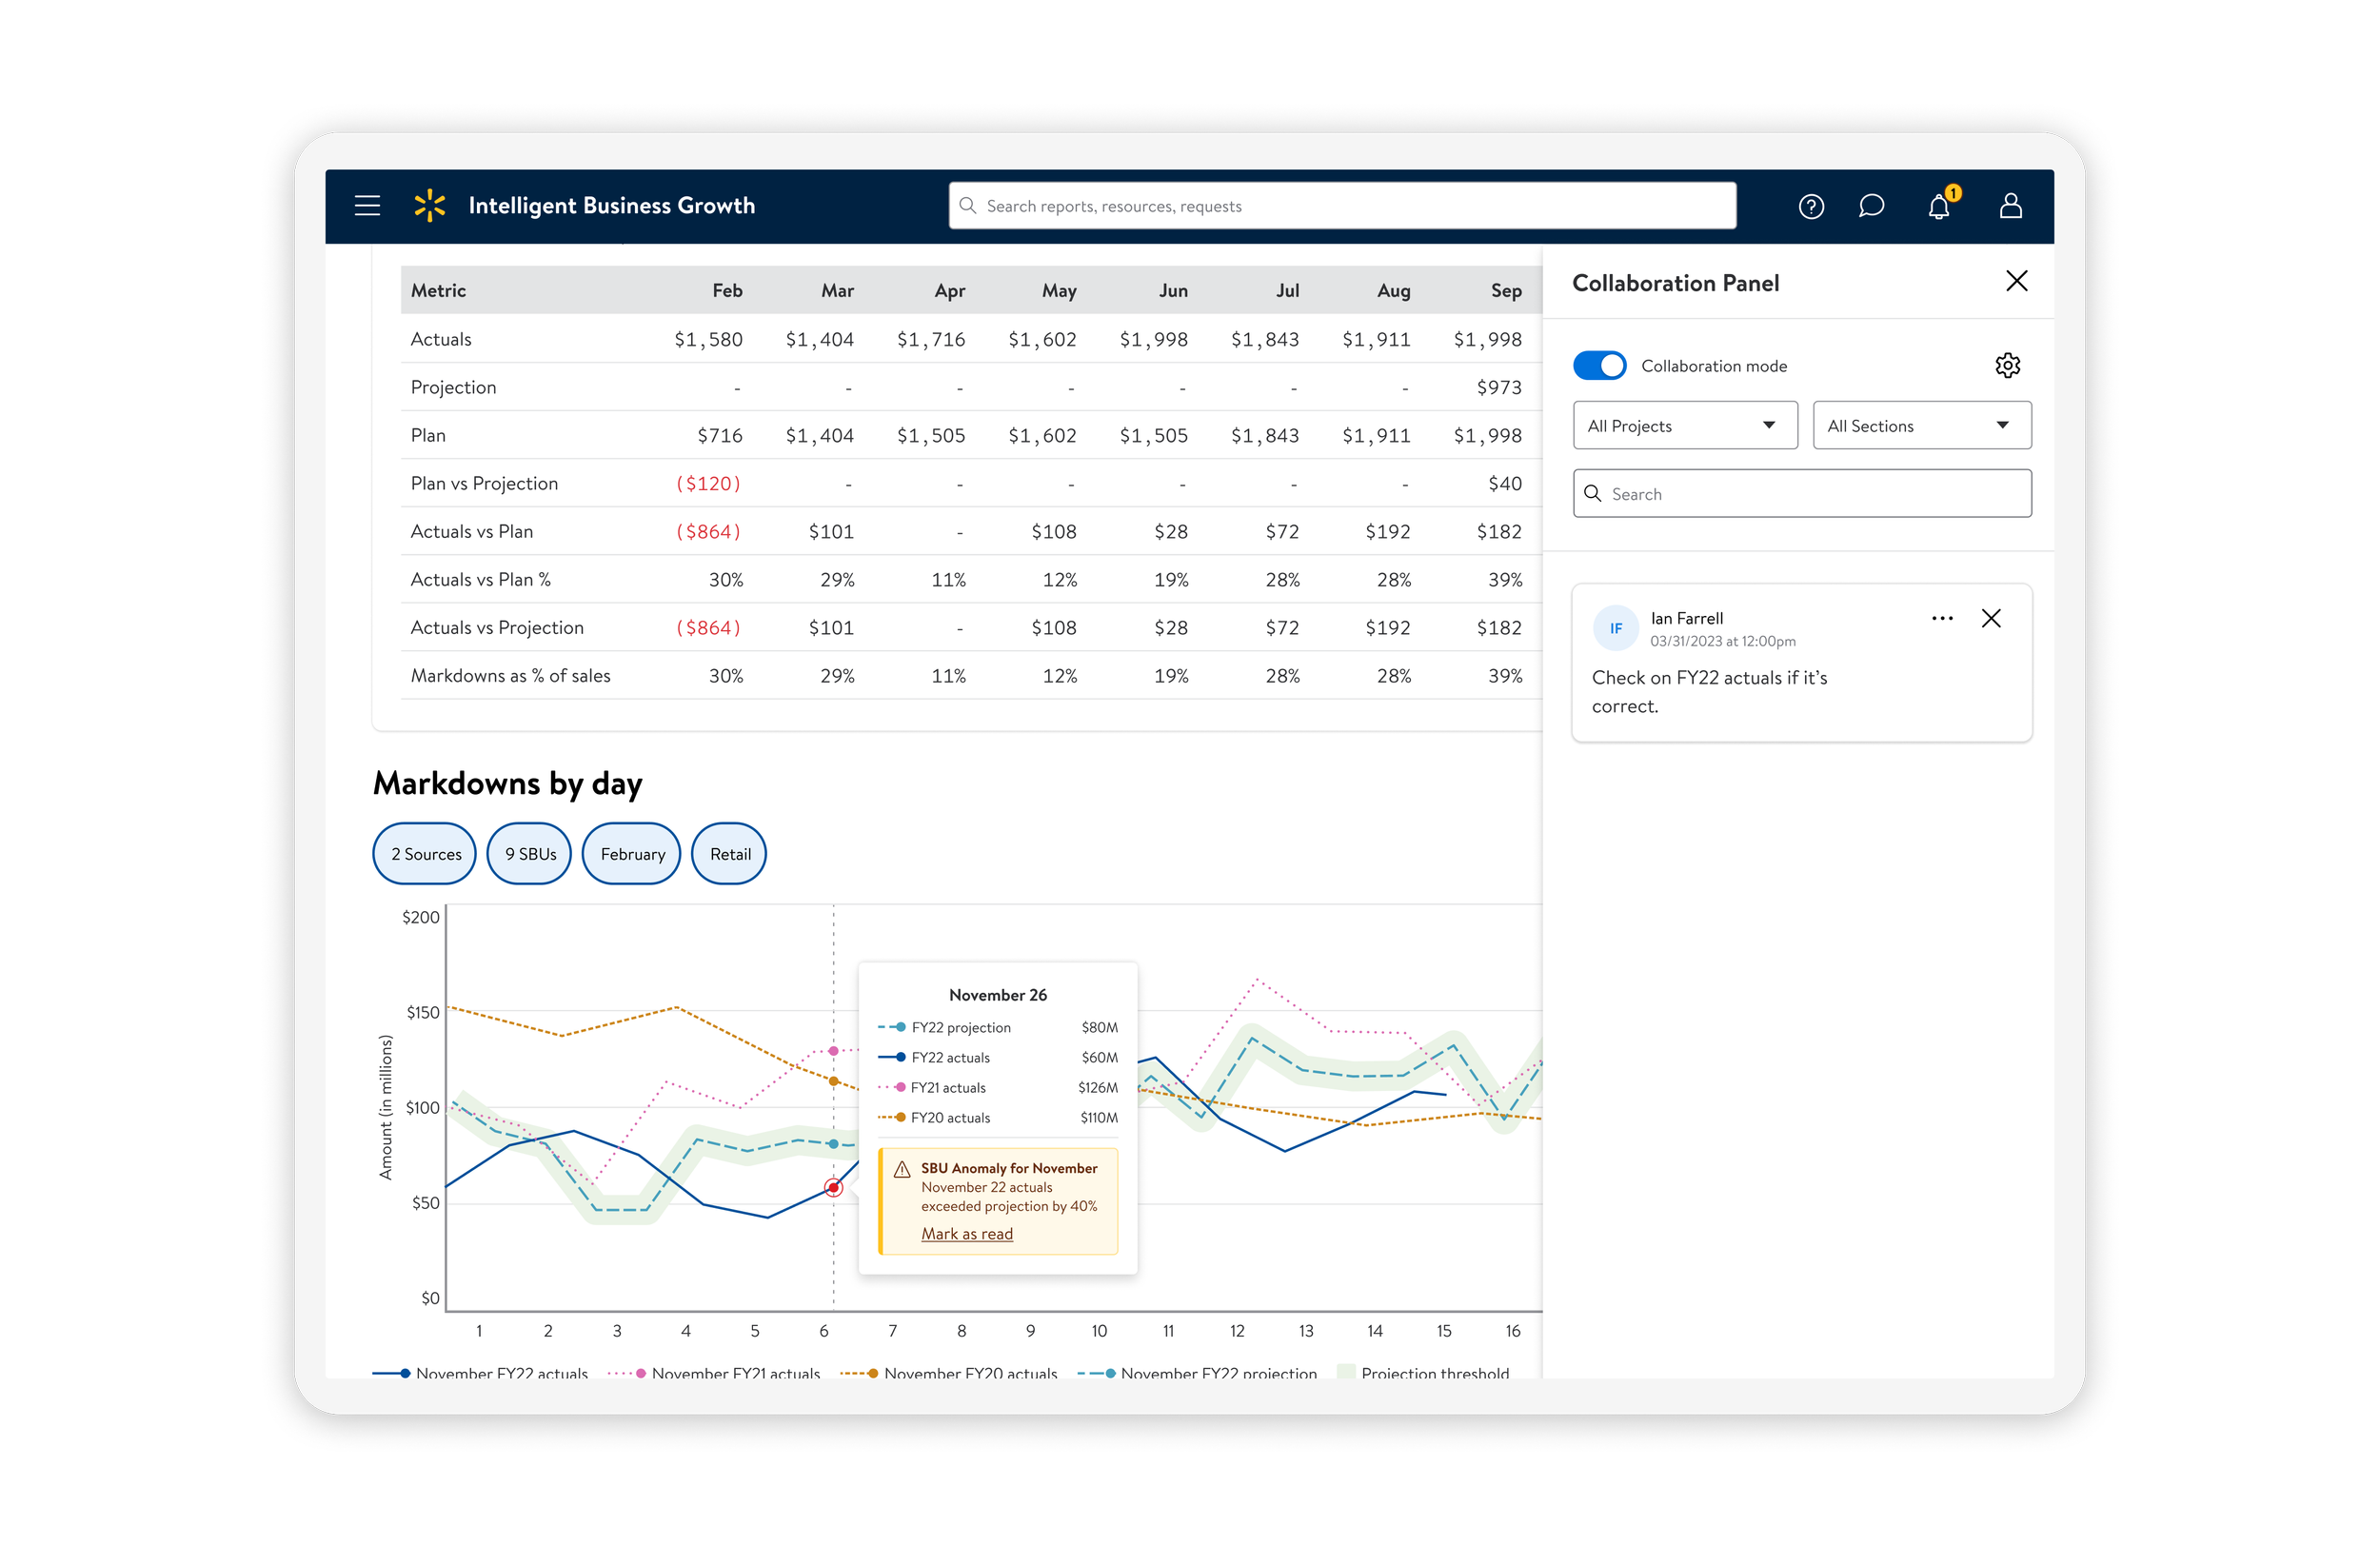
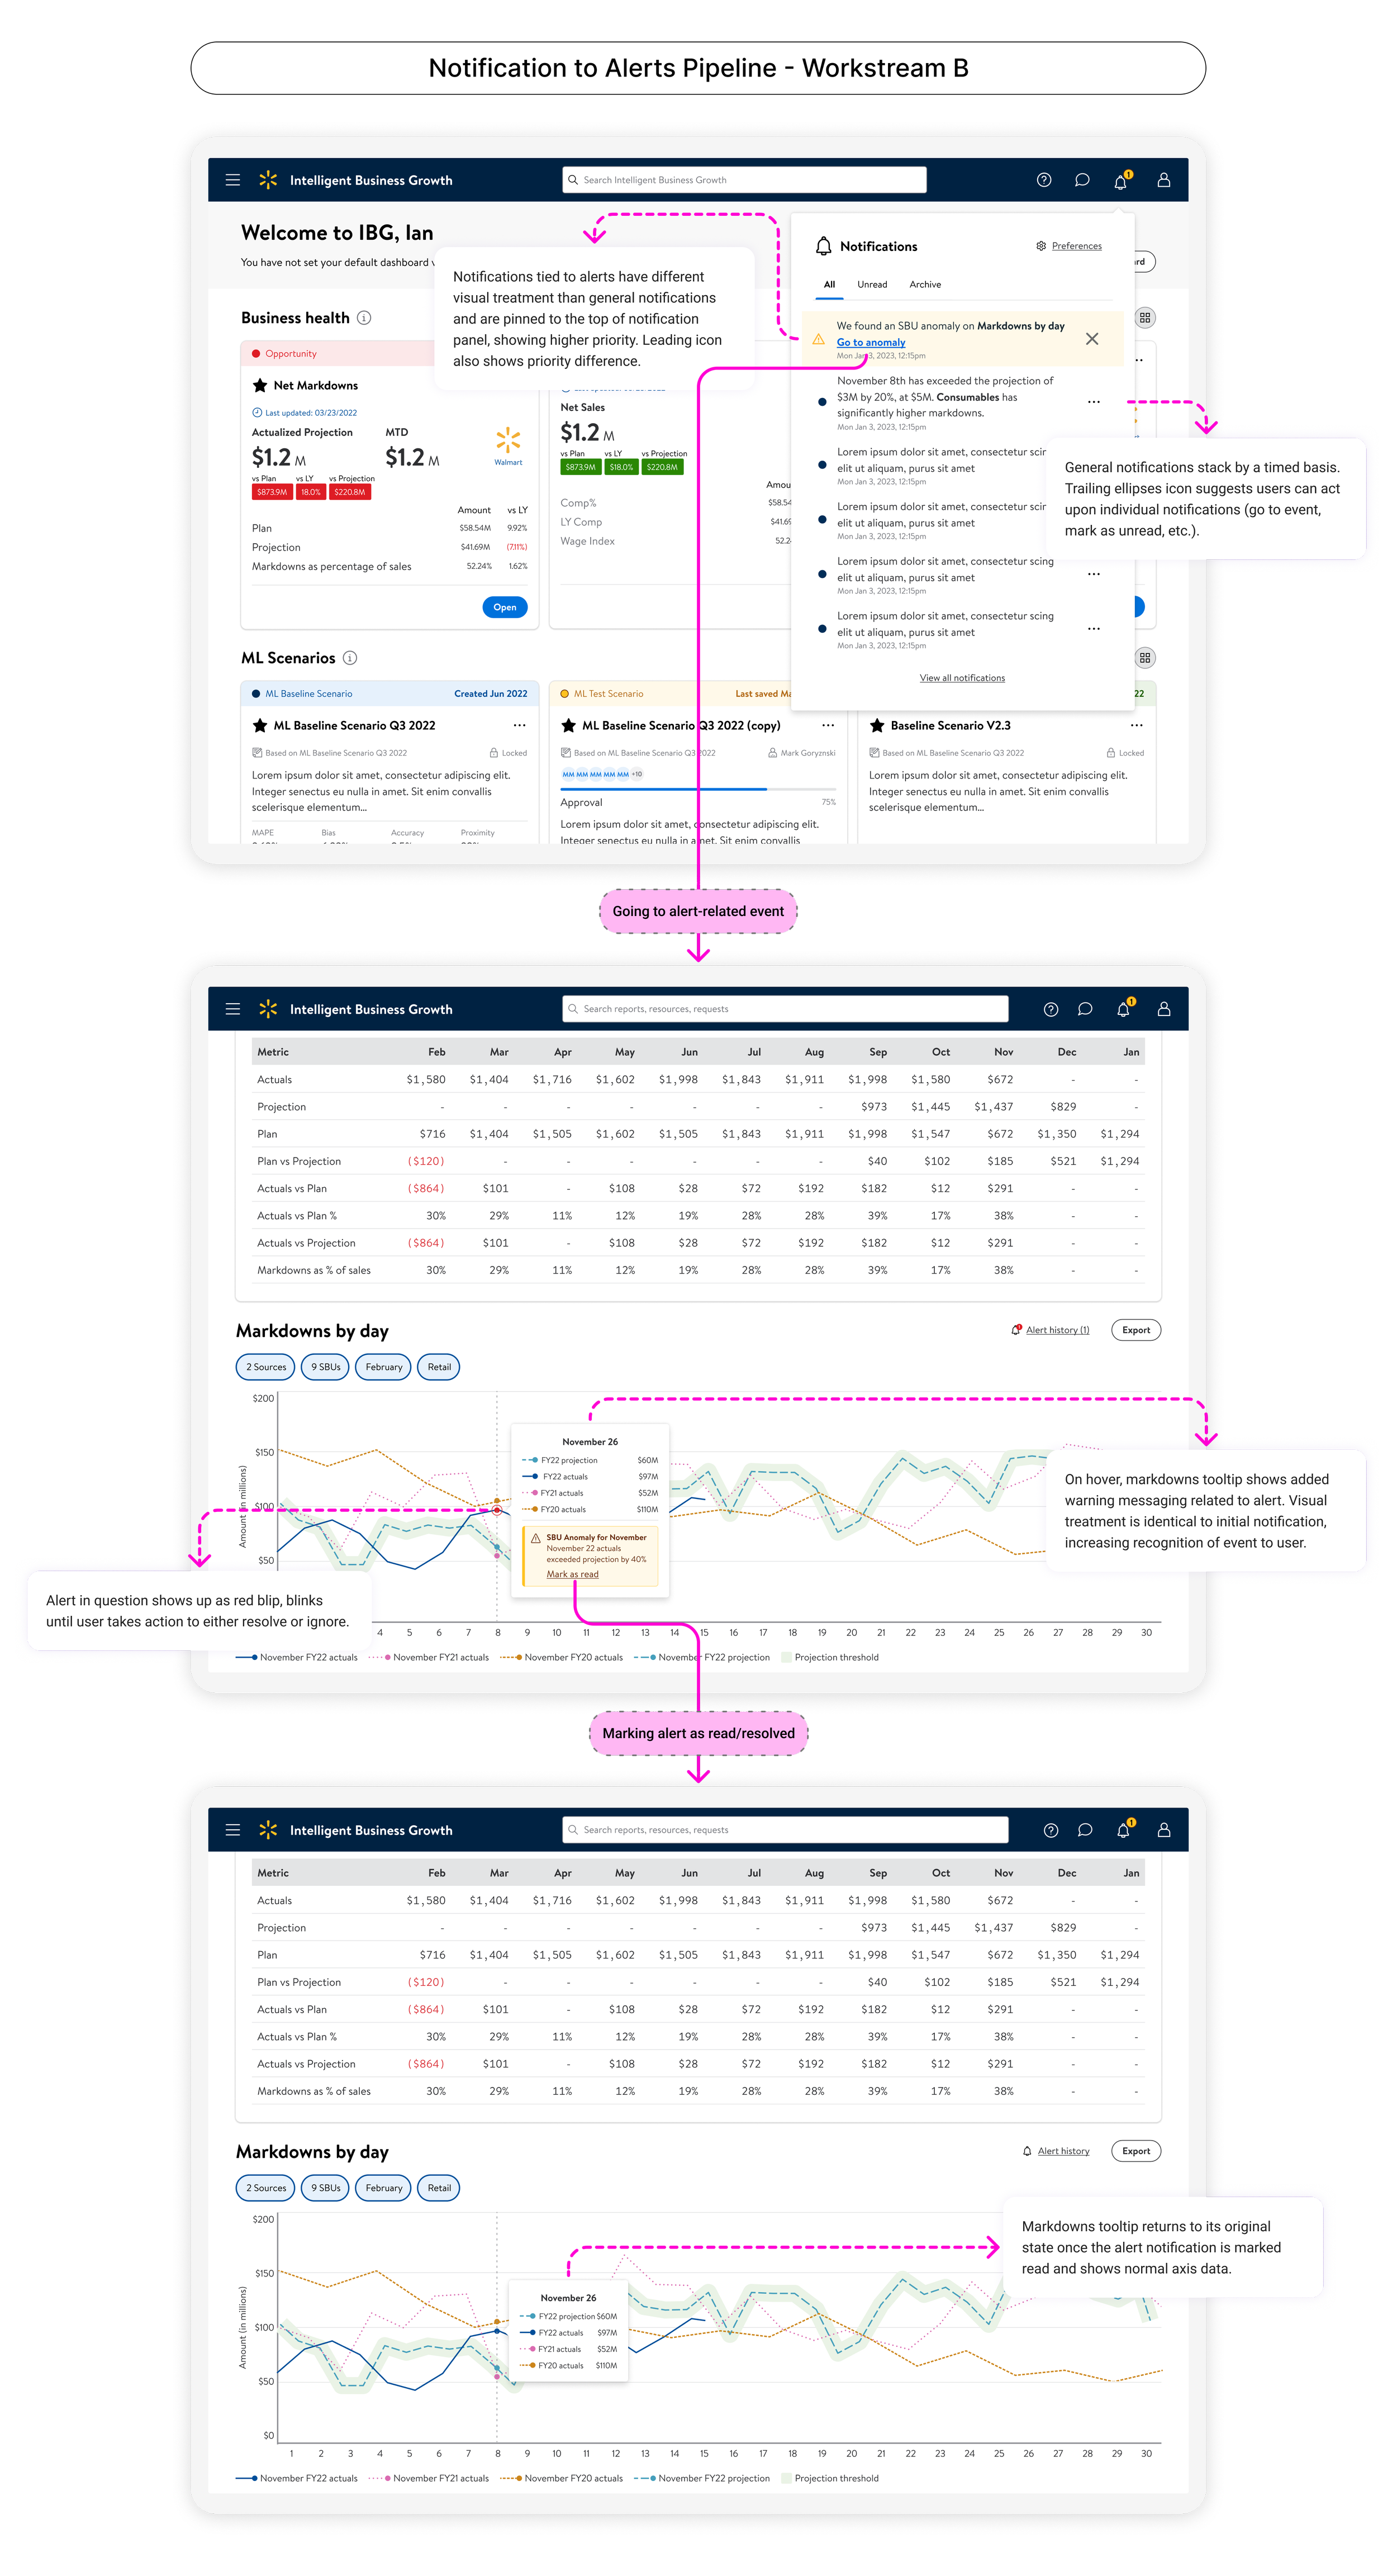
Alerts and notifications
In order to concept out the initial portion of this work, it was necessary to define alerts and notifications and how they should function within our system:
Alerts - Visual cues intended to attract users’ attention to a particular piece of content or UI element that is dynamic in nature. They’re both contextual and conditional.
Notifications - Informational messages that alert the user of general occurrences within our system. Notifications can be tied to alerts or they can be related to some other event.
By labeling these, centering the work around visual alerts, notifications tied to those alerts, and general notifications became key in my initial exploration.
Alerts and severity
Through cross-workstream reviews, it became clear that not all alerts carry the same urgency. Some workflows called for informational indicators rather than action-driven prompts. Severity level was ultimately left to each workstream's designer to define.
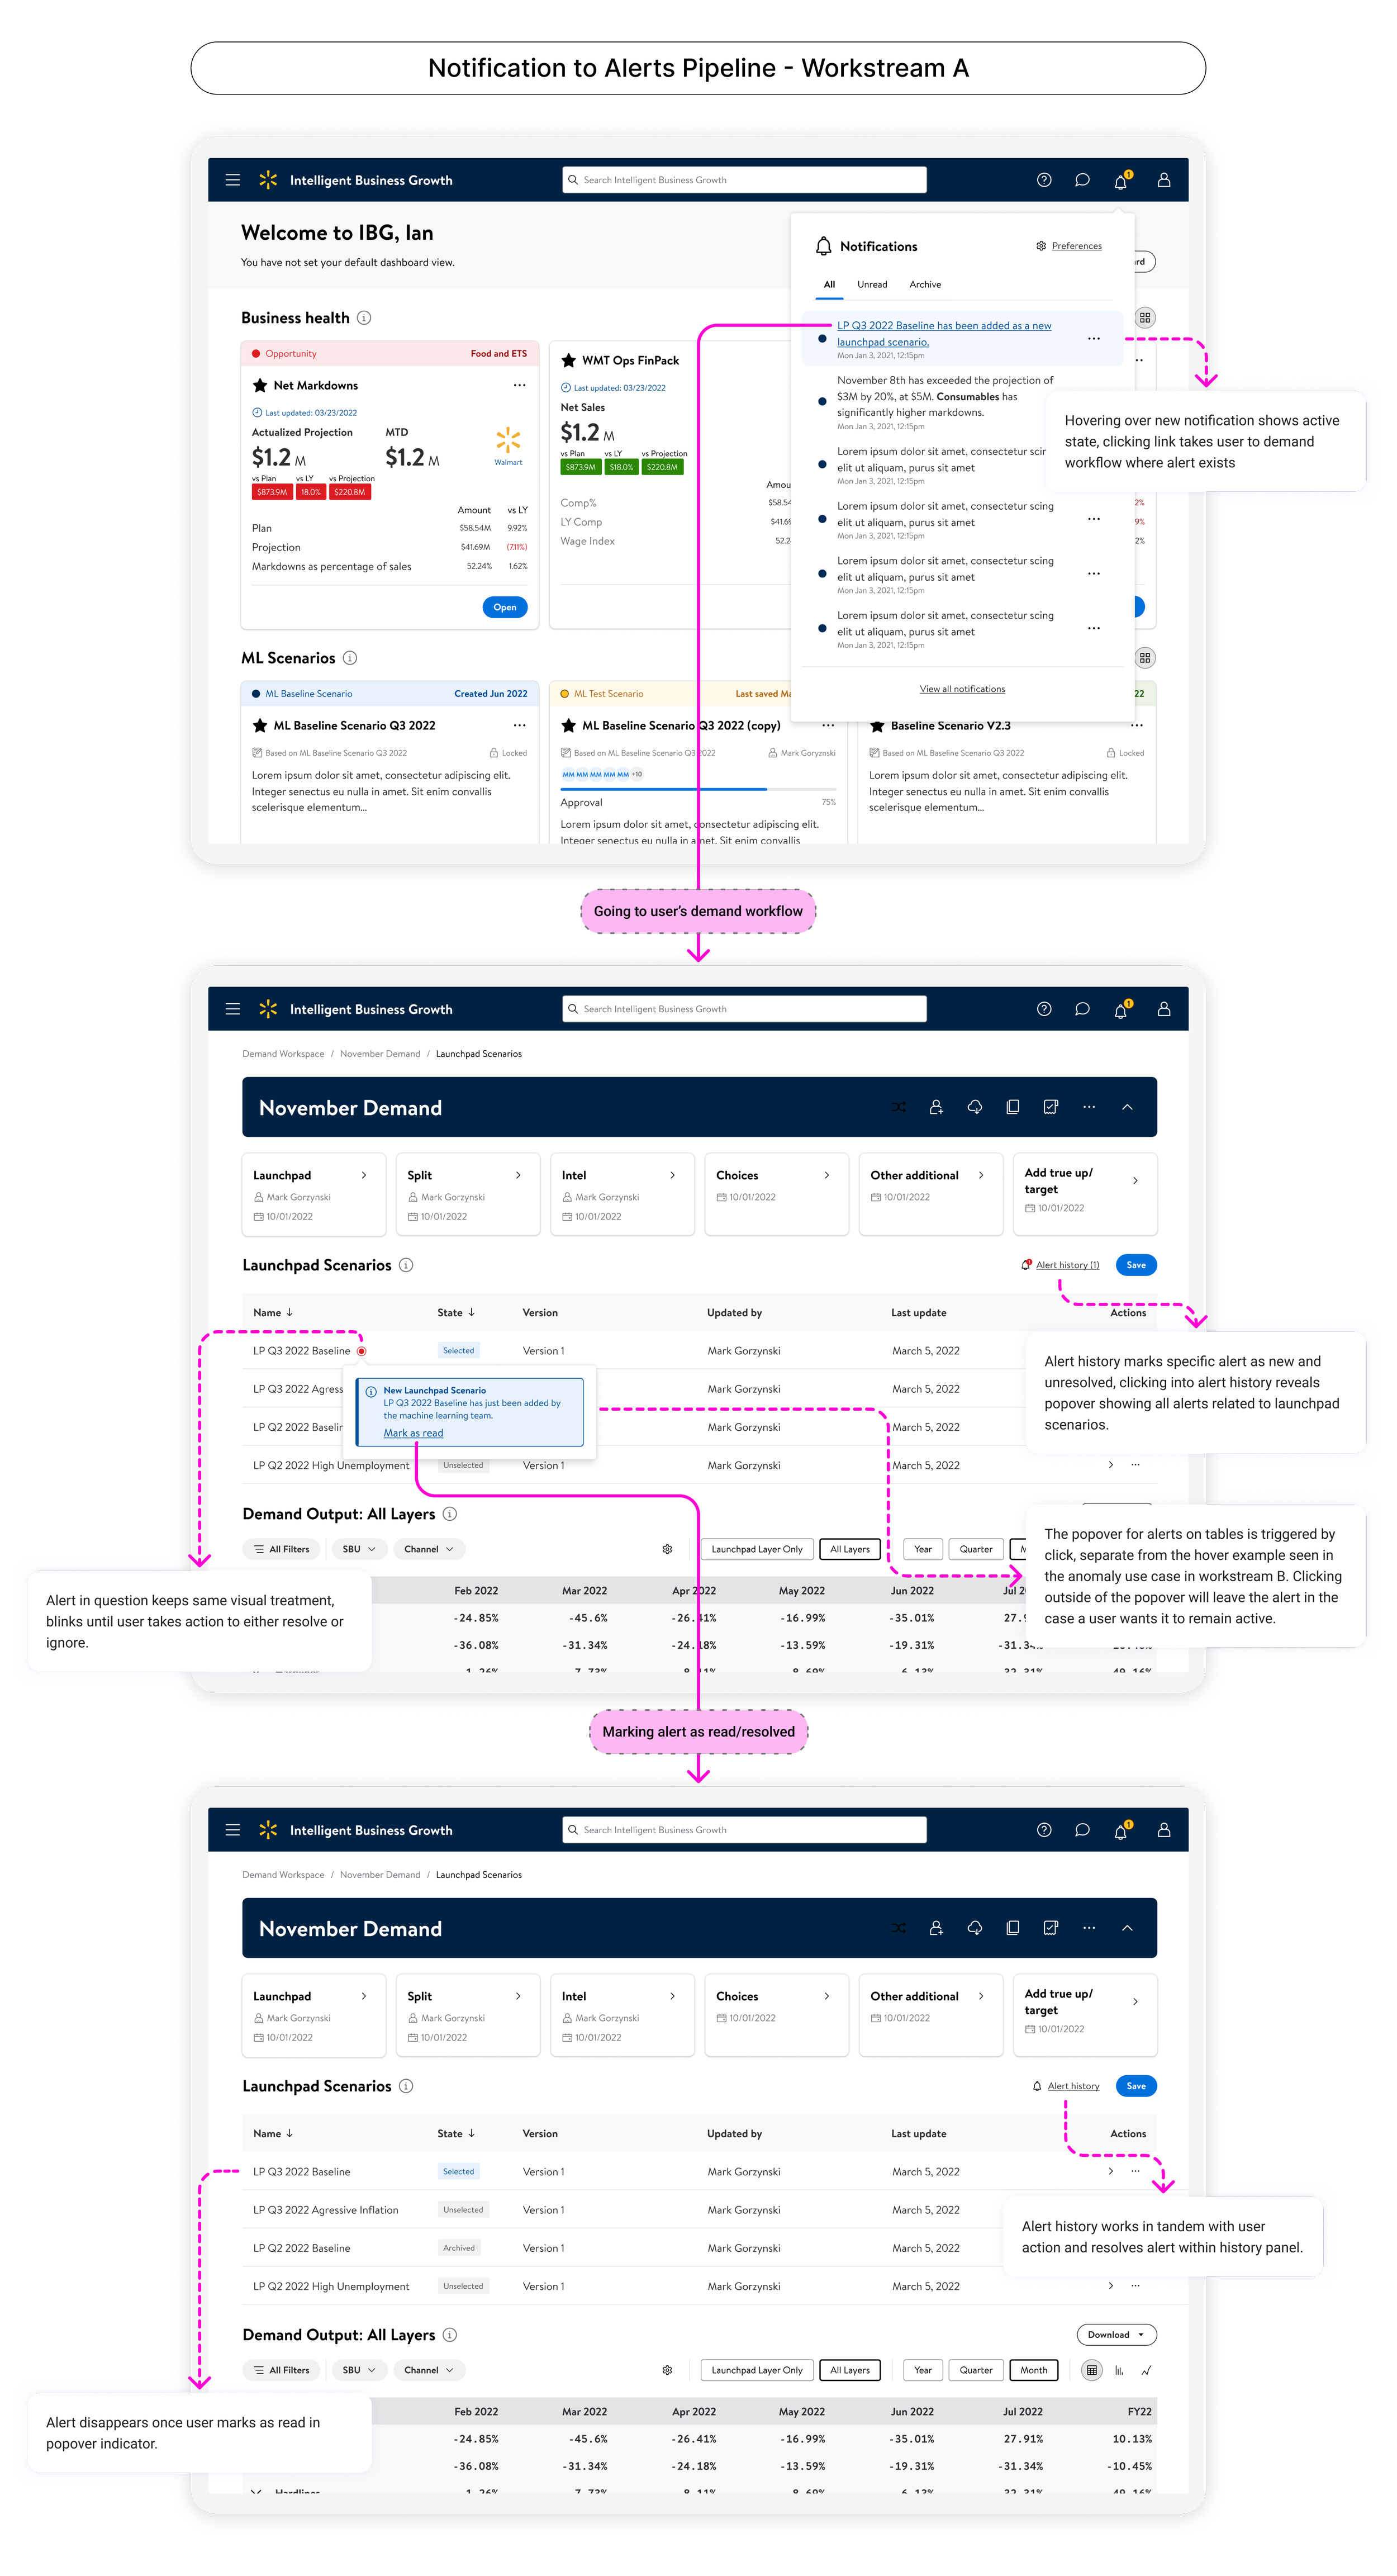
In situ
Collaboration and commenting
For collaboration, I distinguished between personal notes and comments intended for others, covering use cases like discussions and action item tracking. The work focused on single comments, threaded replies, and how comments rendered differently across data tables versus visualizations.